Home (This page)
Home (This page)

Equipment

Chart 1 - Outdoors

Chart 2 - Indoors 

Chart 3 - Airblower

Conclusions

Photos


    Simple Experiment to Measure Sound Propagation

    by  Ron Vickery   12/4/99
Since I am hard of hearing and have poor word discrimination, I am interested in how sound travels and gets messed up so badly. I can hear and understand fairly well when the sound is good. But most often the sound is not good due to noise and room acoustics. I think reverberation is a big factor and I think interference patterns cause some frequencies to be accentuated or diminished. I realize that many researchers have done experiments like this and experiments more complicated than this, with professional equipment.  While I could just read about their experiments in a book, and I do that as much as possible, I find that doing an experiment myself and seeing the results is rewarding.


Home (Top)
 

Equipment 
 

Chart 1 - Outdoors
 

Chart 2 - Indoors
 

Chart 3 - Airblower
 

Conclusions
 

Photos

 EQUIPMENT


Tone Generator ===>Amp ===>Speaker            <== dB Meter
  

A audio pure tone generator is feeding an amplifier and speaker. The speaker is about eight inches in diameter in a wooden box.  The digital dB meter is on a tripod and aimed at the speaker at 1, 2, 4, 8, & 16 ft. intervals.

Initial setting of the gain on the amplifier was to give a 100 dB reading at 3KHz, at a distance of 1 ft., and the gain was not altered from this setting. The dB level of each tone at each distance was then measured. 

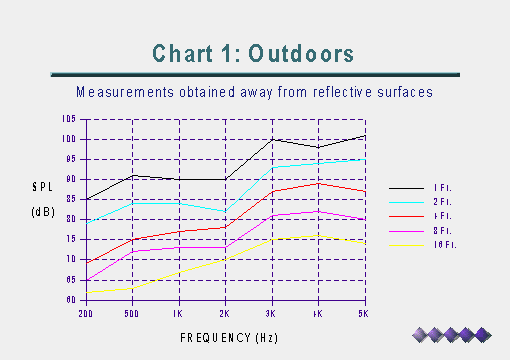
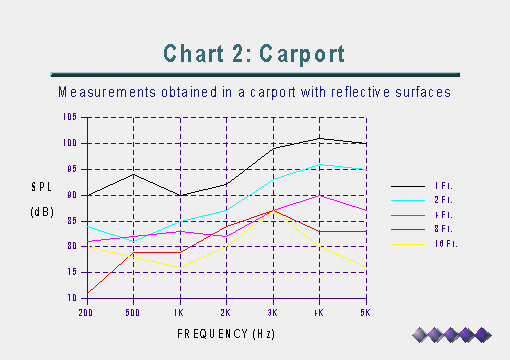
I performed the measurements two times.  Chart 1 shows the results with the equipment set up outside away from any buildings.  Chart 2 shows the results with the equipment set up in a carport,  which is closed in on three sides with wood walls, a concrete floor and a plywood ceiling.

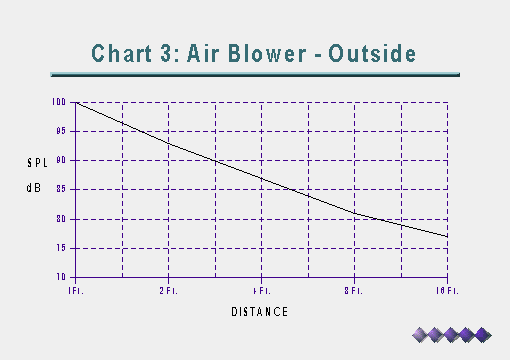
Chart 3 just shows the dB level of an electric airblower at  1, 2, 4,  8,
& 16 ft. intervals.


Home (Top)

Equipment

Chart 1 - Outdoors

Chart 2 - Indoors

Chart 3 - Airblower

Conclusions

Photos


Home (Top)

Equipment

Chart 1 - Outdoors

Chart 2 - Indoors

Chart 3 - Airblower

Conclusions

Photos


Home (Top)

Equipment

Chart 1 - Outdoors

Chart 2 - Indoors

Chart 3 - Airblower

Conclusions

Photos


Home (Top)

Equipment

Chart 1 - Outdoors

Chart 2 - Indoors

Chart 3 - Airblower

Conclusions

Photos

Conclusions

  • Each time the distance was doubled, the dB level dropped about 6 dB. This can best be seen on Chart 1 for 3 KHz.
  • High frequencies propagate about the same as low frequencies, within the range under question.
  • Reflective surfaces play a major role in frequency response, probably due to interference patterns. The reflected wave interferes with the direct wave causing the dB level to be higher or lower than expected. This varies with frequency and distance.
  • This experiment does not address the difference in propagation of vowels versus consonants. Sound engineers call this the articulation of a sound system in a given room. Since I am hard of hearing and have poor word discrimination, it is a vital subject for me and further experiments are in order. I believe the conclusion above for reflective surfaces play a role since vowels seem to have more power than consonants and the reflection of vowels may mask out the much needed consonant sounds.


Home (Top)

Equipment

Chart 1 - Outdoors

Chart 2 - Indoors

Chart 3 - Airblower

Conclusions

Photos


Sorry, no photos yet. I did take some but I have 
not got the film processed. No digital camera!!